Spectro
Spectro turns an audio file into a spectrogram and looks for signs of lossy compression. It can also compare two files and show where they differ. I made it because I wanted to understand more of the math behind audio.
Sound, but you can see it
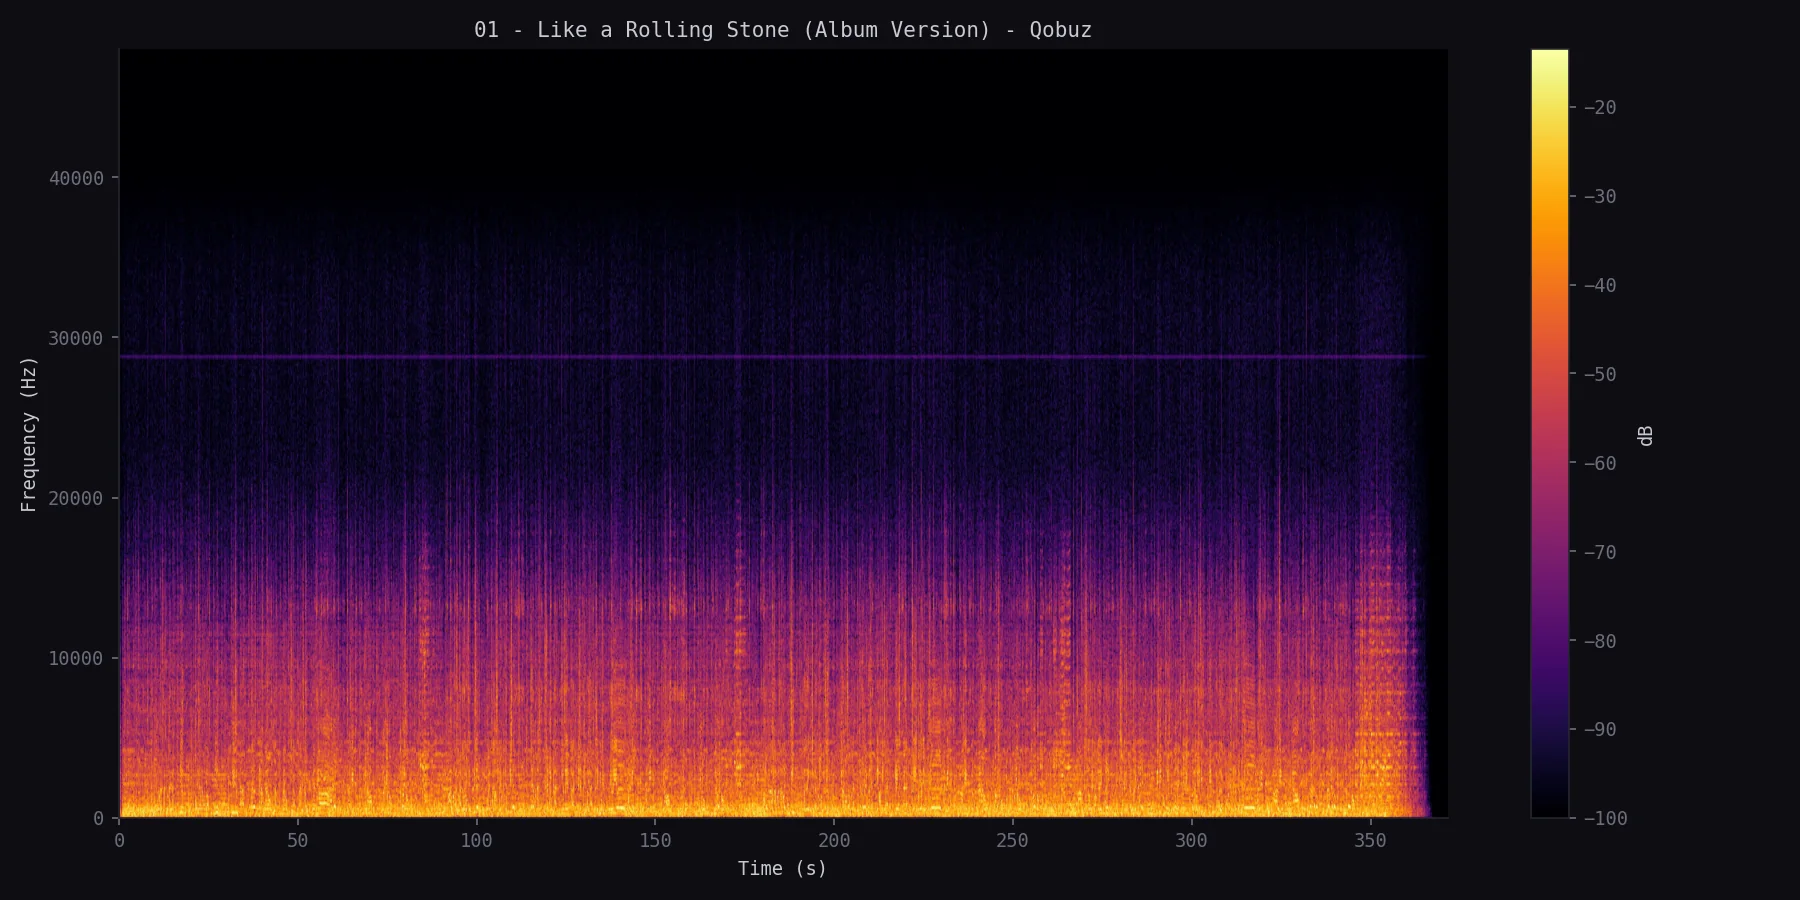
A spectrogram shows how the frequencies in a recording change over time. A waveform leaves most of that hidden.
Just show me the spectrogram
Point it at a file and you get a clean spectrogram that pops open on its own. If you want a log frequency axis, it's there, and if a script wants the numbers instead of the picture, it'll hand back a JSON report.
A quick look, right in the terminal
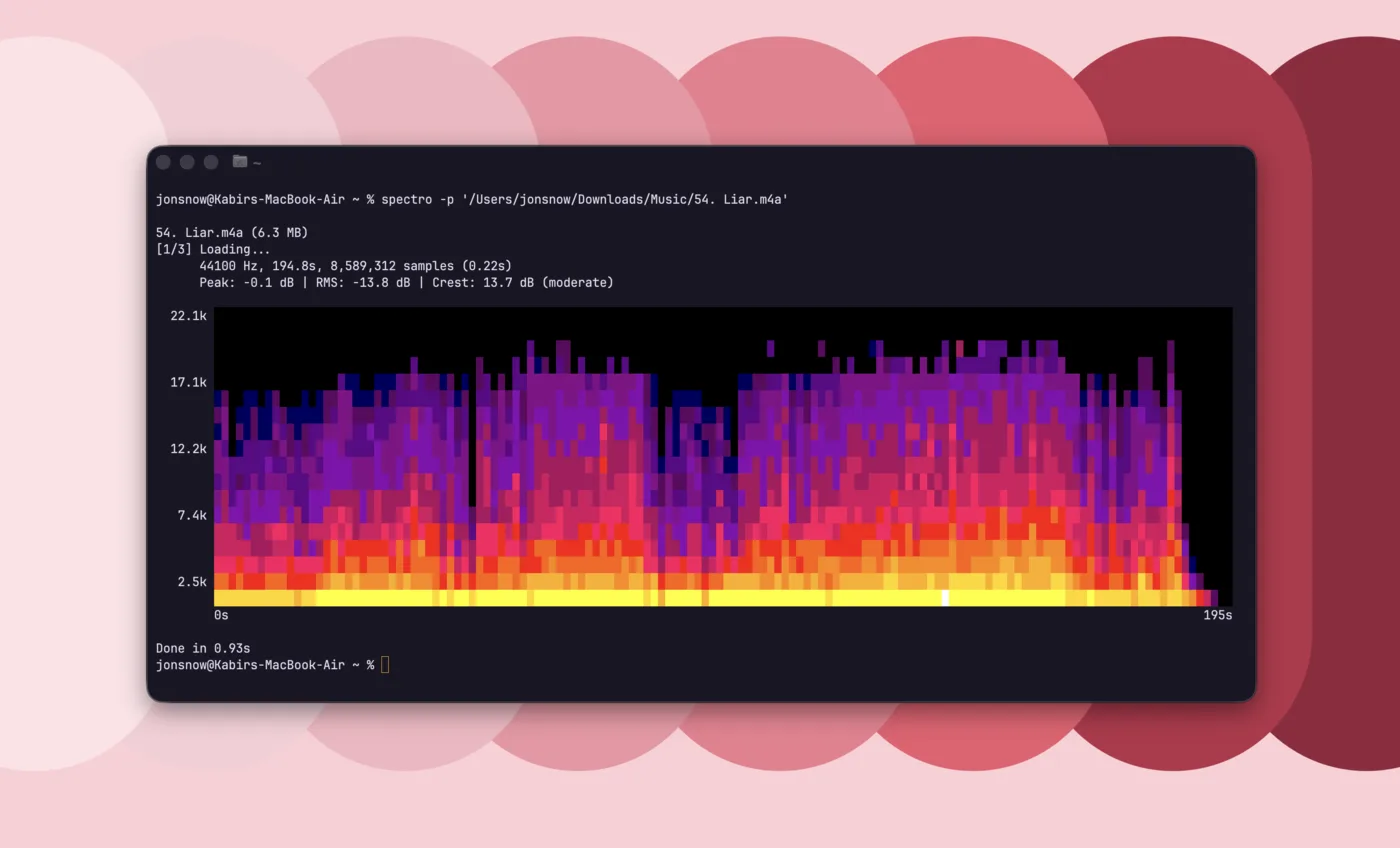
Sometimes you don't want a whole PNG, you just want a peek. This draws the spectrogram straight into your terminal in 256 colours (with an ASCII version for terminals that don't do colour). It skips matplotlib entirely, so it's done in milliseconds.
Look for lossy audio
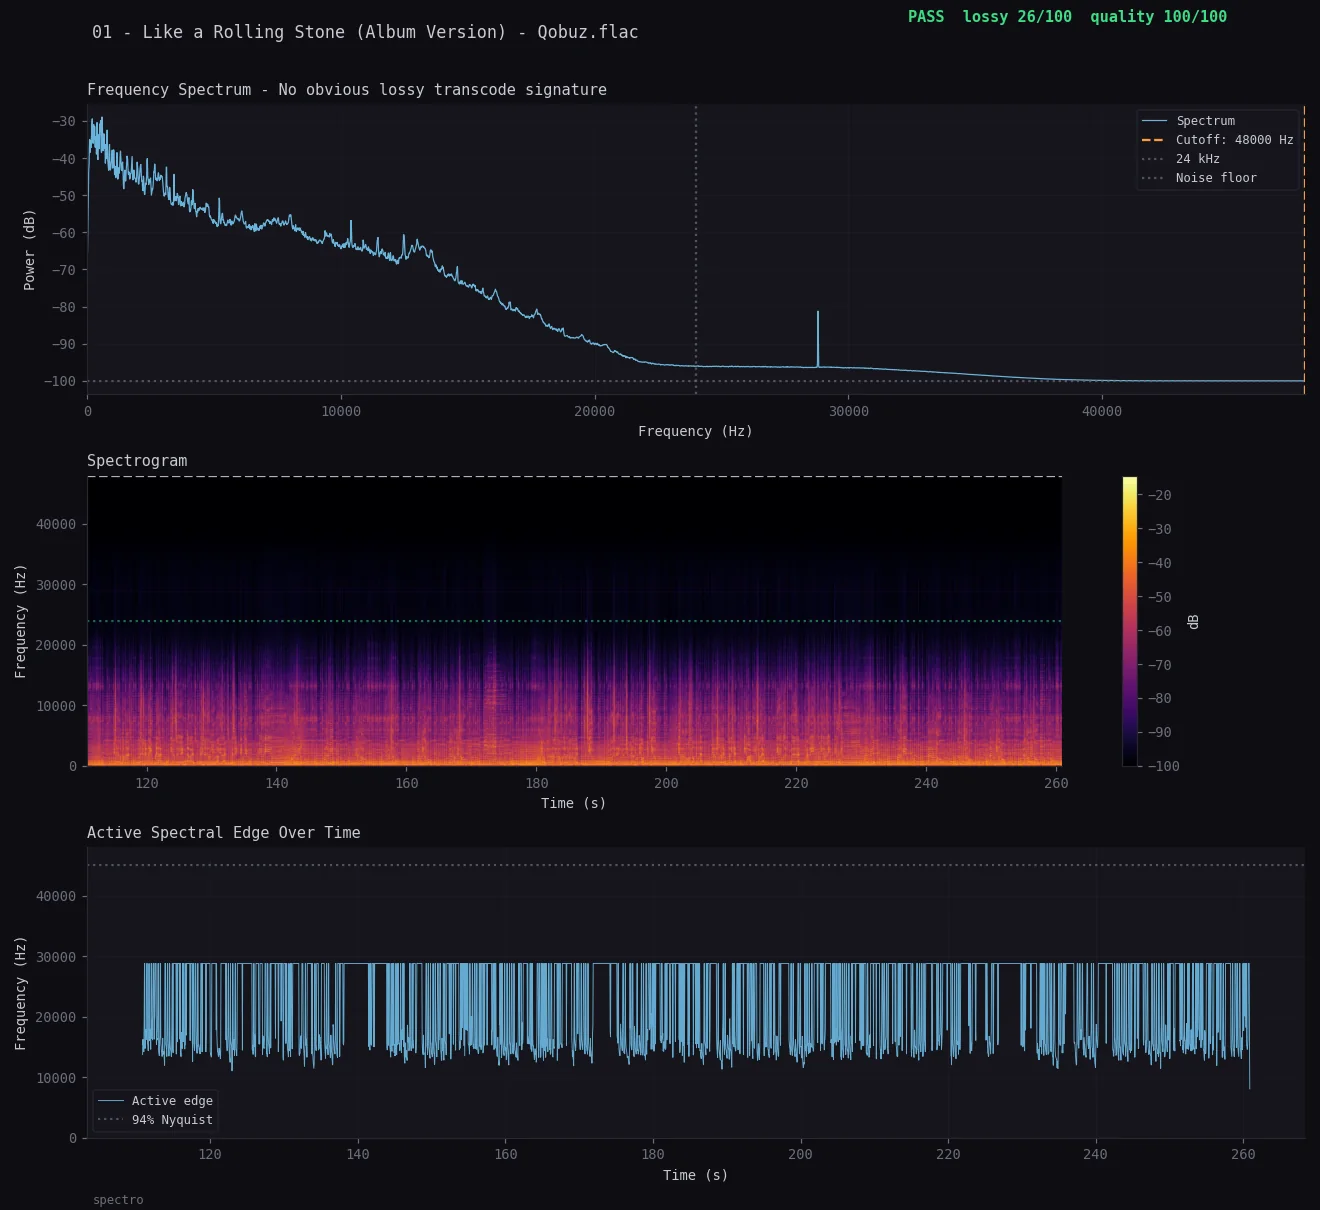
Detect mode scores the evidence out of 100 using six signals: spectral edge, slope, jitter, band ratio, rolloff stability, and SBR likelihood. It also checks for padded bit depth and stereo files that are really mono. You can run it across a whole album and get one table back.
Put two files head to head
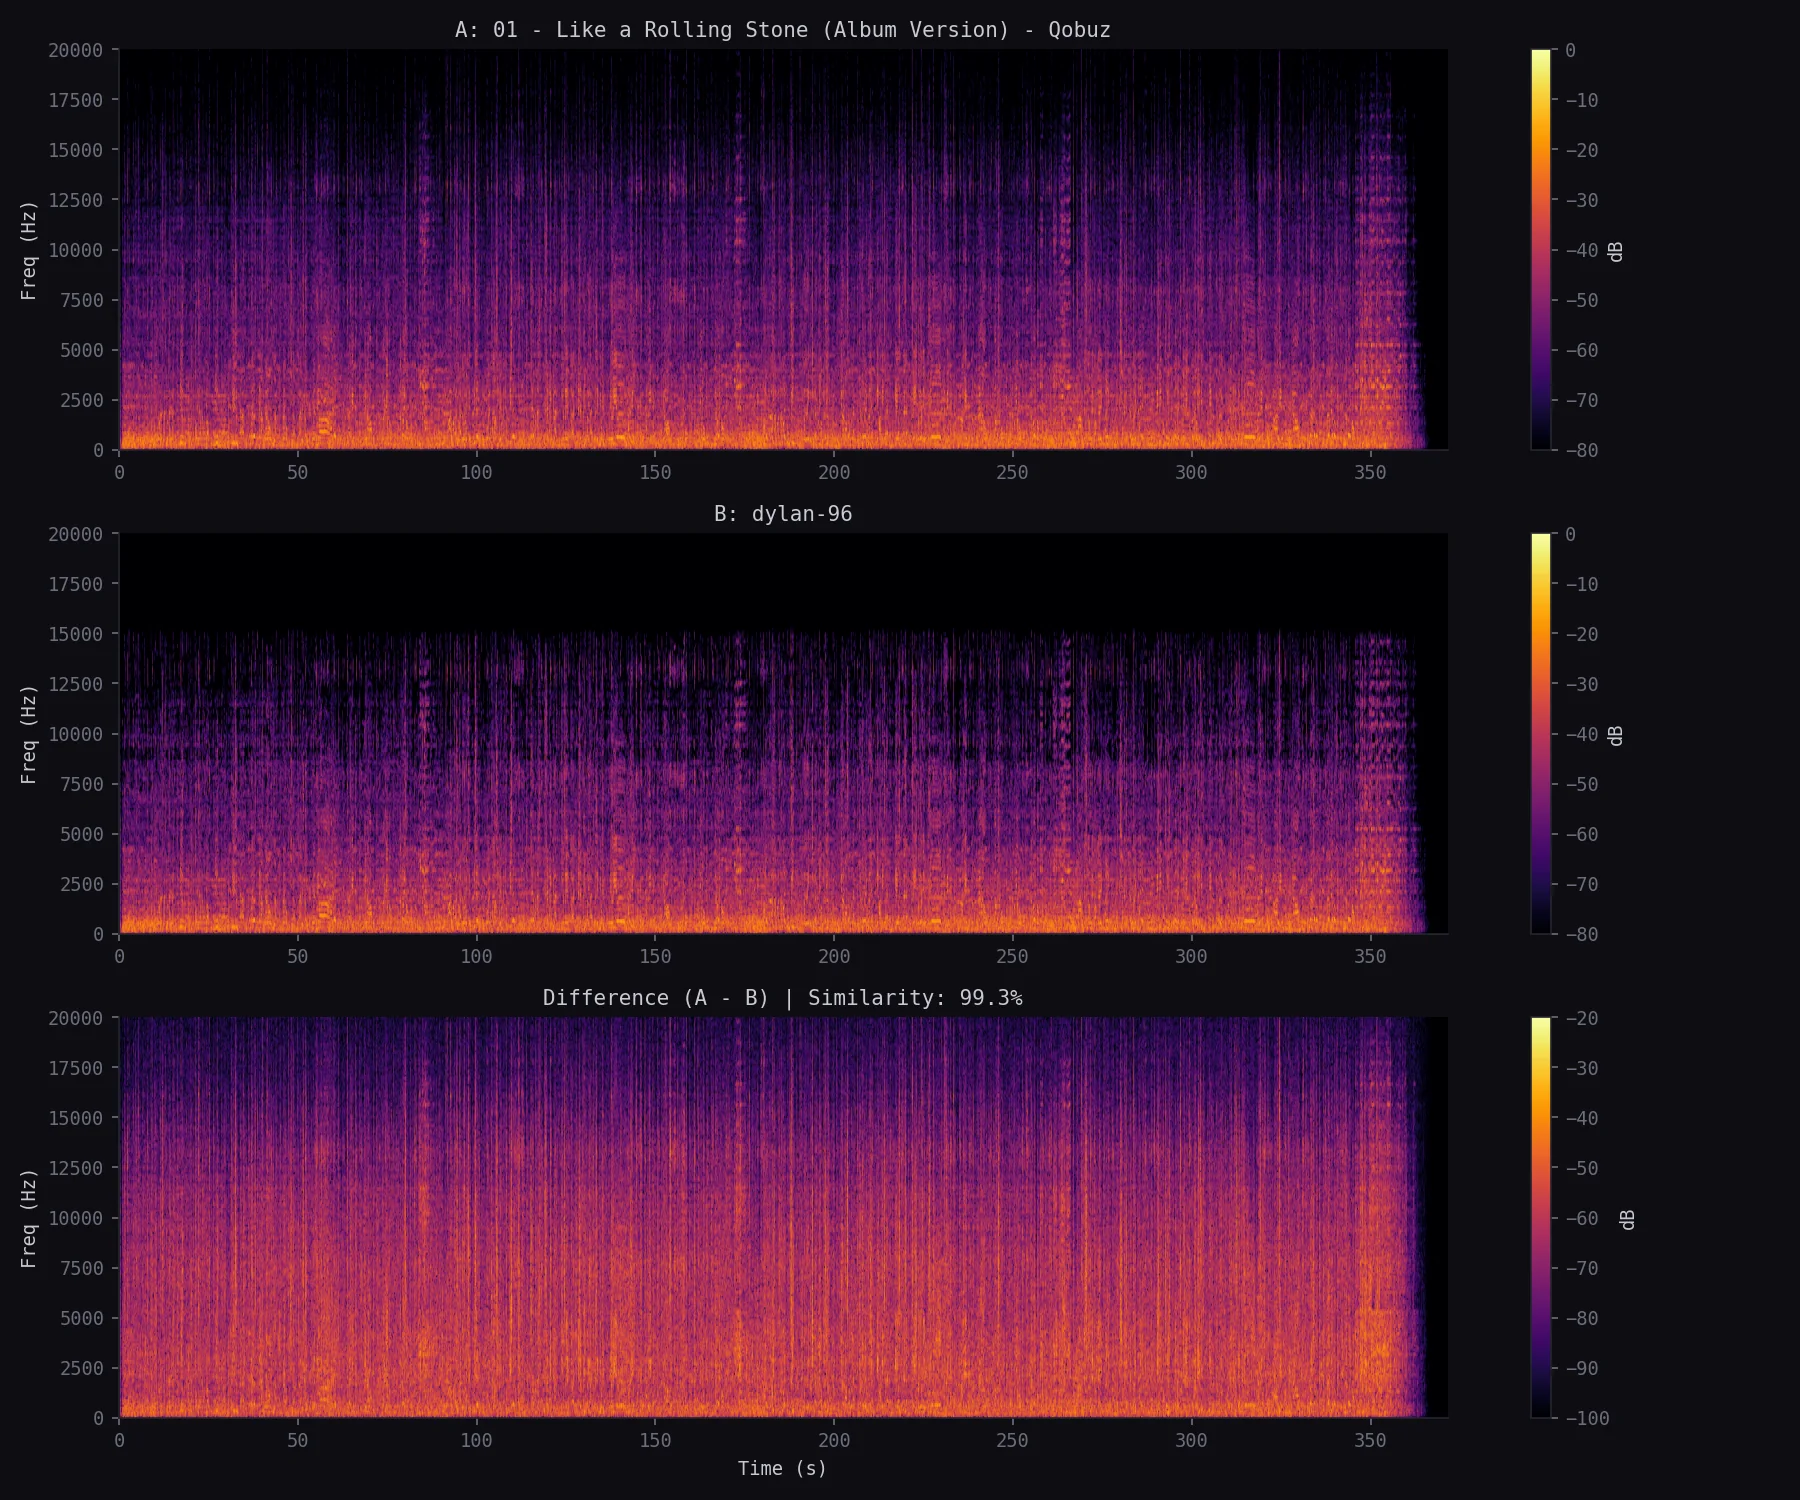
Give it two versions of the same track and it lines them up, then shows the source, the conversion, and what changed between them.
Mostly to learn the math.
I wanted a quick way to spot files that had been resampled or upconverted, but mostly I wanted to understand what I was looking at. Python made it easy to try ideas while I learned the audio analysis behind them. Spectro is where those experiments ended up.
"A frequency cutoff is a pretty good sign of lossy compression, but it's not absolute proof. And no cutoff doesn't mean it's lossless either. Spectro shows you what's there, and you get to draw your own conclusions.
"